News
July 30th, 2022
Recap of a Poster Session from the SSP 2022 Annual Meeting
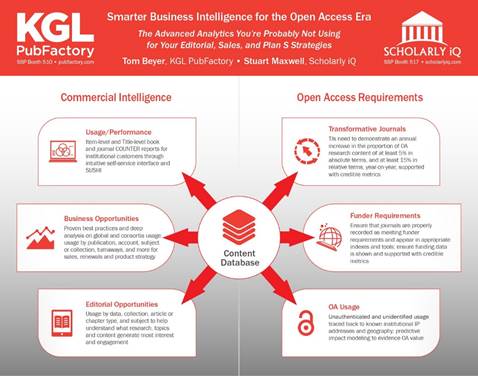
Recently at the Society for Scholarly Publishing Annual Meeting, KGL PubFactory’s Director of Platform Services, Tom Beyer,together with longtime platform partner, Stuart Maxwell, COO of Scholarly IQ, presented a poster on the advanced analytics available to publishers that many are still not using for their editorial, sales, and Plan S strategies. For those that struggling with analysis paralysis trying to identify Open Access usage or meet reporting requirements for transformative journals, we recap the highlights of the findings and discussion here.

Historically, providing COUNTER Title reports and a SUSHI API have been the absolute standard—the minimum bar that scholarly publishers have needed to achieve across the board. It’s very important for academic libraries, but it turns out that this repository of usage data holds a trusted trove of incredibly important information that publishers should want to delve into.
This was supported in the change to COUNTER Release 5 with new opportunities of a higher level of granularity offered by new Item Level Reports. Whilst not mandatory, many publishers have opted to provide these for the increased transparency and accountability that accompanies industry agreed metrics and standards for individual articles, chapters, books, multimedia etc.

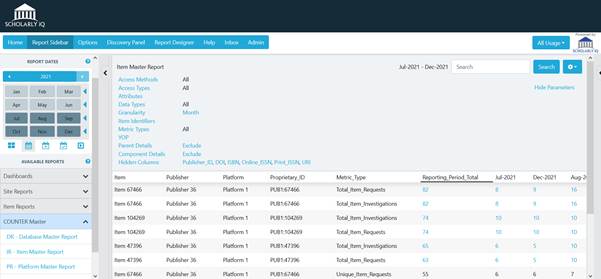
The Item Master Reports provide the largest number of component parts – varying from Item to Platform and Author to YOP as standard and with flexibility to extend further parameters enabling both librarians and publishers to dive even deeper into understanding usage with trusted data at this atomic level. This was simply not available for COUNTER 4 and Title level reports as the metrics were aggregated and rolled up to Journals or Books (see Item Level Reports, the future of usage reporting and analytics?).
So how does this support smarter business intelligence for the Open Access era?
First, there are some obvious business opportunities embedded in that item level data to be mined from global and regional usage. When compared with actual subscribing institutions, this data of course provides pointers for where to focus sales efforts. Subscribing institutions can also be matched against turnaway data for another clear upsell opportunity, where users at existing customers and proven subscribers are still trying to download content that they don't have access to. Lastly, low-usage institutions should be managed closely, because of the potential for them to not renew in the next cycle.
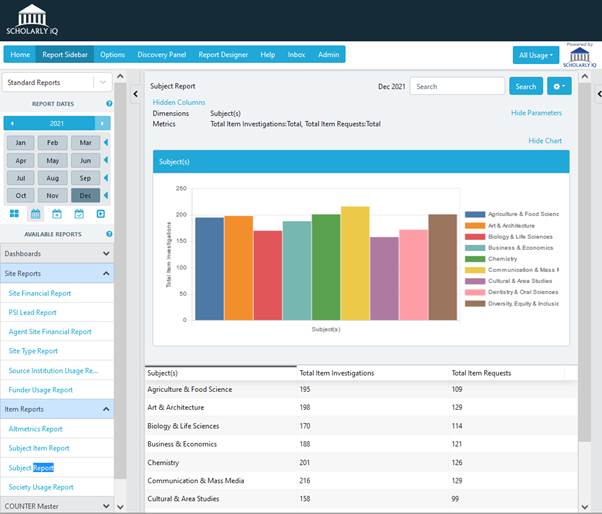
Similarly, there is a lot of useful information for editorial staff when the metadata associated with individual content items is surfaced in coordination with usage data. Identifying trends in the item data (and not by journal subject for example) by keyword, subject, collection, and content type can reveal which content is trending within identifiable segments, which can then be fed back to the editorial side of the business.

Then of course, there is Open Access content. On the surface, it seems like this should be much easier. There are no subscribers; it’s just out there and there are no pay walls. But of course, things are never quite so easy. If you're a journal publisher and you're entering into transformative agreements, there are reporting requirements that you must adhere to. In general, publishers of transformative journals need to monitor and show that the percentage increase of OA content is growing at least 5% in absolute terms and 15% in relative terms, year over year. And this information needs to be reported to cOAlition S and also shown on the publisher’s website.
Publishers should also be looking very carefully at funder mandates and put operations in place to manage those various reporting requisites. For authors that receive funding, what metrics are required? Oftentimes, publishers are asked to combine usage data with production and editorial data, and then assemble reports in one format or another and again, make this available.
The whole impetus for the OA movement was to increase the impact of content, and one way to do that is to trace usage. It may largely be unauthenticated usage, but publishers can trace it back to the institutions with newly available tools that track known IP addresses. They can also compare the distribution, regionally or in other ways, of OA usage compared to subscription usage to demonstrate which content is being accessed more broadly. Trusted performance data at the item level supports and provides evidence of meeting mandated criteria for OA content, the standard is moving in that direction and publishers or their partners not meeting these requirements will soon be found to be behind the times.
Finally, there is potential in the future for taking this content and using it as a predictive tool—comparing new content with historic trends for associated content that are embedded in the data to try to predict how new content would perform within certain defined parameters. KGL and SiQ are already providing publisher services for the highest level of compliant OA reporting and are pushing forwards testing predictive models, ready for supporting the next wave of innovation in OA publishing.
Since the SSP Annual Conference at the beginning of June Project COUNTER has opened a Community Consultation for Release 5.1, designed to better facilitate Open Access reporting.
One of the most significant changes is a new focus on Item as the primary unit of reporting, further supporting the use cases discussed in this poster session.
If you would also like to discuss these upcoming COUNTER changes with us, particularly if your current provider is not compliant with the Item level reporting standard, please contact KGL or SiQ for more details.
To learn how to unlock the potential in your usage data, contact Tom Beyer or Stuart Maxwell, or click to read more about IntelWorks, the KGL PubFactory platform’s advanced reporting and analytics module.

 Facebook
 LinkedIn
 Twitter